Bug fixing in Gentoo: How we are performing
I've been playing with matplotlib and
Gentoo bug numbers from the last ~6 month to be able to see how we are
performing at fixing bugs lately. This is the current output:
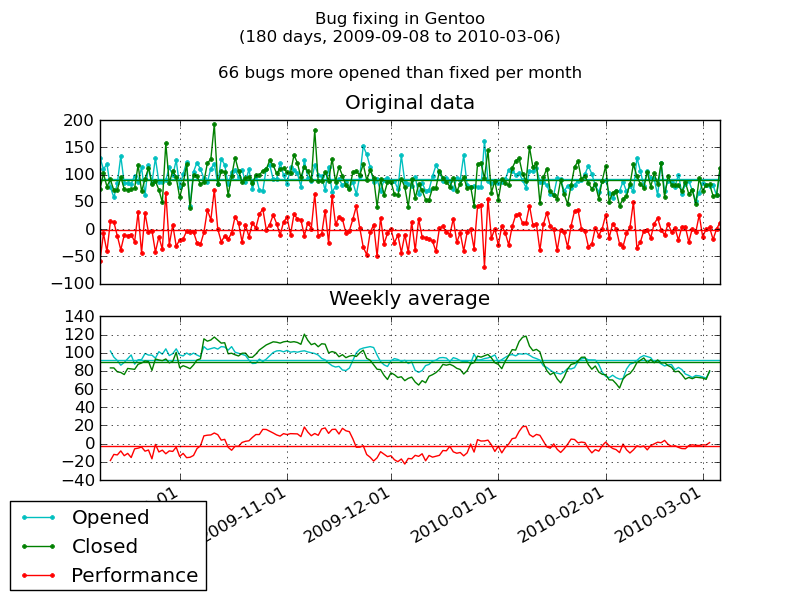 While I am surprised how many bugs we
fix each day I am also shocked that each month almost 70 bugs go on top of the
current pile. What else can we read from that graph? It seems Gentoo's users
are willing to report bugs (which is cool) but its contributors cannot fully
keep up with fixing them (which is less cool). I am presenting this graph
today to suggest that:
While I am surprised how many bugs we
fix each day I am also shocked that each month almost 70 bugs go on top of the
current pile. What else can we read from that graph? It seems Gentoo's users
are willing to report bugs (which is cool) but its contributors cannot fully
keep up with fixing them (which is less cool). I am presenting this graph
today to suggest that:
- Bugzilla stats have interesting things to tell
- Fixing bugs could use more attention, manpower and a better process in Gentoo
- The planned re-write of bugday.gentoo.org could play a keys role with improving the process
- A Gentoo Google Summer of Code project could work on software to continuously extract detailed bug statistics for us
- You can do neat plots using Python and matplotlib :-)
[EDIT] The source code to produce above graph is now available.